This post is about generating sequence diagram using a tool called plantuml. It can be used for a lot of things, but I use it mainly for sequence diagram generation.
Sequence diagram is used to describe message-based protocols (like network TCP/UDP). That said, I have used it to visualize a lot of things. For example:
- Bus transaction (write/read)
- side-band signals (interrupts)
- req/ack handshakes
- power sequence
- FSM state changes
- UVM messages
Basically, Anything I can parse from logs.
Example Link to heading
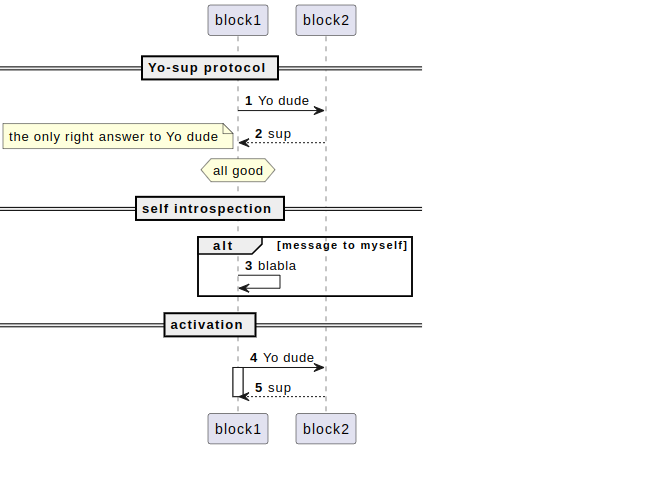
This is small example to show the basic features. I used notes over and next transactions, Separators, and groups. Check out the documentation. Sky is the limit.
@startuml
autonumber

== Yo-sup protocol ==

block1 -> block2: Yo dude
block2 --> block1: sup
note left: the only right answer to Yo  dude


hnote over block1: all good

== self introspection ==
alt message to myself
block1 -> block1: blabla
end

== activation ==
block1 -> block2: Yo dude
activate block1
block2 --> block1: sup
deactivate block1

@enduml
To run plantuml, it’s easy enough
java -jar $PLANTUML/plantuml-1.2023.1.jar -tpng ex01.txt -tsvg
And I use a browser because I can search texts in SVG’s. bonus point :)

PS. The way I use it, I generate sorted array of names tuple in Python and generate the plantUML file.