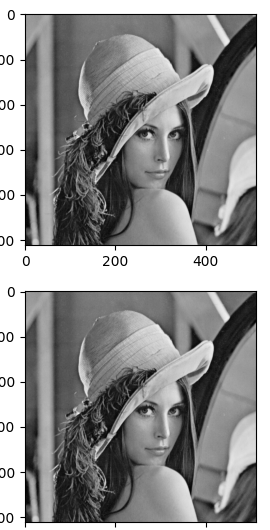
I started this post with a attempt to show the difference between RGB and YCbCr. but that was easy enough so i added one round of dct/idct to see the effects on grey scale(if any).
Link to heading
The main difference between RGB and YCbCr is that instead using Red/green/blue, YCbCr is using gray(luminance) and Red/Blue differences. It’s mainly due to the fact human eye detects gray scale better than color scale which allows more aggressive compression for color components.
The equation to convert from RGB to YCbCr is from wiki

With that out the way, I thought it would be fun to do DCT then IDCT to see if DCT/IDCT makes visible change in the image. I found dct2 and idct2 from SO (for 2-D DCT based on scipy 1-D DCT).
And there are no visible differences between original gray scale and final image after DCT/IDCT. I did subtract them and differences are mostly 1.42108547e-14.

import numpy as np
from scipy.fftpack import dct, idct
import imageio.v2 as imageio
import matplotlib.pyplot as plt

def rgb2ycbcr(image):
    R = image[:, :, 0]
    G = image[:, :, 1]
    B = image[:, :, 2]

    Y  = 0                          + .299     *  R + .587      * G  + 0.114   * B
    #Cb = np.ones[image.shape] * 128 - 0.168736 *  R - 0.331264  * G  + 0.5      *
B
    #Cr = np.ones[image.shape] * 128 + 0.5      *  R - 0.0.418688* G  - 0.081312 *
B
    return Y

rgb = imageio.imread('./Lenna.png')
ycbcr = rgb2ycbcr(rgb)

# DCT/IDCT
gray = ycbcr
def dct2(a):
    return dct(dct(a.T, norm='ortho').T, norm='ortho')
def idct2(a):
    return idct(idct(a.T, norm='ortho').T, norm='ortho')

dct_im = dct2(gray)
idct_im = idct2(dct_im)

_, plots = plt.subplots(2)
plots[0].imshow(gray, cmap="gray")
plots[1].imshow(idct_im, cmap="gray")
plt.show()