DFT is one of most important transformation ever invented.It’s used in almost every application(compression, filters, etc). From wiki,
In mathematics, the discrete Fourier transform (DFT) converts a finite sequence of equally-spaced samples of a function into a same-length sequence of equally-spaced samples of the discrete-time Fourier transform (DTFT), which is a complex-valued function of frequency.
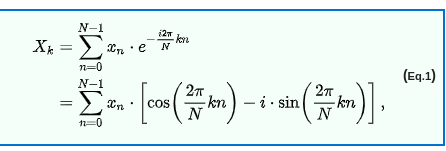
Basically, FT represents sum of basis frequencies (2pik/N) scaled with coefficients. DFT calculates these coefficients using the following equation

Simple and inefficient implementation does O(n^2) multiplications and additions.
import numpy as np
import matplotlib.pyplot as plt

# Input wave
FS = 128
T = 2

x = np.arange(0, T, 1/FS)
f1= np.sin(2* np.pi * 1 * x)
f = np.sin(2* np.pi * 8 * x) +  np.sin(2* np.pi * 4 * x) + f1

# DFT
N = f.shape[0]
F = N * [complex(0,0)]

for k in range(0, N):
    for n in range(0, N):
        F[k] +=  f[n] * np.exp(complex(0, -2* np.pi * k * n/N))

# Calc and plotting
freq = FS * np.arange(0, N)/ N
dft = np.abs((F))

freq1 = freq[0:N//2]
dft1  = dft[0:N//2]

_, plots = plt.subplots(4)

plots[0].plot(x,f1)
plots[1].plot(x,f)
plots[2].plot(freq, dft)
plots[3].plot(freq1, dft1)

plt.show()
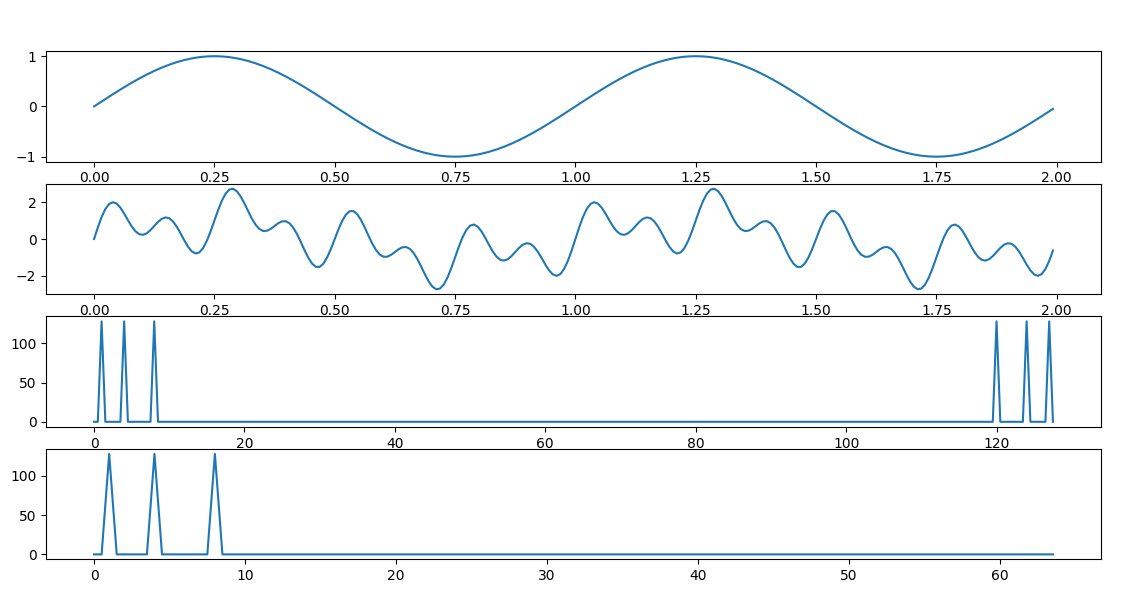
The output shows the frequency domain. plot 3 shows the full the freq domain which is mirrored around N/2(DFT is symmetric around FS/2). Well, I think that’s important considering the sampling freq Nyquist frequency is highest freq that can be represented by FS sampling.
