While the world is on fire, I wanted something light to do to get my mind off the news. So, I decided to look at another crisis. Ireland Housing Crisis :)

Anyone who is familiar with Ireland knows about the housing shortage. So, Like everyone here, I check daft on daily basis(several times a day actually).
I thought it would be fun to scrap Daft.ie and do basic analysis on the data(nothing fancy!). I am using jupyter notebooks because as all the cool kids use it :)
I am planning to setup cron job on AWS to scrap daft.ie and notify me once there is new listing. who needs daft.ie emails when you can send your own.
The packages Link to heading
Here is quick run down of the packages used:
- requests to handle HTTP session
- pandas to store data in data frame for analysis
- plotly to draw the locations on a map
import os
import json
import pprint
import datetime

import requests
import pandas as pd
import matplotlib.pyplot as plt

import plotly.express as px
HTTP Session and REST API Link to heading
Well, Without documentation, I spent some time tracing xhr requests in the browser to extract the API endpoints and request/response JSON.
s = requests.Session()

# constants
DAFT_API="https://search-gateway.dsch.ie/v1/listings"
AUTOCOMPLETE_URI = "https://daft-autocomplete-gateway.dsch.ie/v1/autocomplete"
PAGE_SIZE = 50
CORK_ID = 35

headers = {"User-Agent" : "Mozilla/5.0 (X11; Linux x86_64) AppleWebKit/537.36 (KHTML, like Gecko) Chrome/89.0.4389.128 Safari/537.36",
          "platform": "web",
          "brand": "daft"}
Getting the listings Link to heading
Next, I needed to format the request JSON. Mainly, I needed CORK_ID so i had to grab that from the browser.
The way it works, I had to do it in two steps
- Get the pages pages
- iterate over the pages one by one to get listings per page
# Get listings
def get_listings(data, headers=headers):
    # Get paging info
    r = s.post(DAFT_API, json=data, headers=headers)
    paging = r.json()["paging"]

    # Get all listing
    listings  = []
    start = 0
    for page in range(1, paging["totalPages"] + 1):
        data['paging']['from']  = start
        r = s.post(DAFT_API, json=data, headers=headers)
        listings.extend(r.json()["listings"])
        start= r.json()["paging"]['nextFrom']

    return listings

# Listings for cork
data= {'section': 'renatls',
  'filters': [{'name': 'adState', 'values': ['published']}],
  'andFilters': [],
  'ranges': [],
  'paging': {'from': '0', 'pageSize': str(PAGE_SIZE)},
  'geoFilter': {'storedShapeIds': [str(CORK_ID)], 'geoSearchType': 'STORED_SHAPES'},
  'terms': ''}


listings = get_listings(data)
listings
I am good to go.
Cleanup and Pandas frames Link to heading
Next step, extract data from JSON object and flatten it in a dict that pandas can read. Also, I converted the weekly rates to monthly to keep it consistent.
frame = []

for l in listings:
    l = l['listing']
    tmp = {key: l[key] for key in l.keys()
                               & {'id', 'price', 'title', 'abbreviatedPrice','publishDate', 'numBedrooms', 'numBathrooms','propertyType', 'seoFriendlyPath'}}

    try:
        tmp['floorArea'] = l['floorArea']['value']
    except KeyError:
        tmp['floorArea'] = None

    tmp['lat']         = l['point']['coordinates'][1]
    tmp['lon']         = l['point']['coordinates'][0]

    try:
        tmp['ber'] = l['ber']['rating']
    except KeyError:
        tmp['ber'] = None
    frame.append(tmp)


df = pd.DataFrame(frame)

# clean up data
df['publishDate'] = pd.to_datetime(df['publishDate'], unit='ms')
df['period'] = df['price'].str.extract('per ([a-z]+)')

df['price'] = df['price'].replace(u"\u20AC", '', regex=True).replace(",", "", regex=True).str.extract('(\d+)').astype(float)
df = df[df['price'].notna()]

# Sort by publish date
df = df.sort_values('publishDate',ascending=False)

# Adjust weekly rate
df.loc[df['period'] == "week", 'price'] *= 4.3
df
Basic analysis Link to heading
Now i have a DataFrame, Calling Pandas describe to get some stats for prices
df["price"].describe()
which prints something like
count      82.000000
mean      588.482927
std       127.536678
min       320.000000
25%       500.000000
50%       580.250000
75%       650.000000
max      1062.100000
Name: price, dtype: float64
Mapping Location to the Map Link to heading
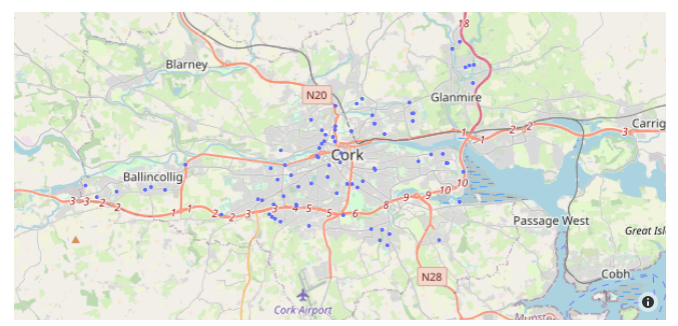
Finally mapping lat and lon to Map using plotly. Useless but looks nice :)
df["color"] = "blue"
fig = px.scatter_mapbox(df, lat="lat", lon="lon",hover_name='price')
fig.update_layout(mapbox_style="open-street-map")
fig.show()
