Garphviz is very useful package to visualize data. They define their own “language” to render the graphs. More details about the dot language.
Example Link to heading
This is example i found on SO and i think it’s great way to quickly visualize diagrams.
digraph G {
    graph [rankdir = LR];

    node[shape=record];
    Bar[label="{ \"Bar\"|{<p1>pin 1|<p2>     2|<p3>     3|<p4>     4|<p5>     5} }"];
    Foo[label="{ {<data0>data0|<data1>data1|<data2>data2|<data3>data3|<data4>data4}|\"Foo\" |{<out0>out0|<out1>out1|<out2>out2|<GND>gnd|<ex0>ex0|<hi>hi|<lo>lo} }"];

    Bew[label="{ {<clk>clk|<syn>syn|<mux0>mux0|<mux1>mux1|<signal>signal}|\"Bew\" |{<out0>out0|<out1>out1|<out2>out2} }"];
    Bar:p1 -> Foo:data0;
    Bar:p2 -> Foo:data1;
    Bar:p3 -> Foo:data2;
    Bar:p4 -> Foo:data3;
    Bar:p5 -> Foo:data4;

    Foo:out0 -> Bew:mux0;
    Foo:out1 -> Bew:mux1;
    Bew:clk -> Foo:ex0;

    Gate[label="{ {<a>a|<b>b}|OR|{<ab>a\|b} }"];

    Foo:hi -> Gate:a;
    Foo:lo -> Gate:b;
    Gate:ab -> Bew:signal;
}
dot program (part of graphviz) is used to generate png
dot -Tpng 1.dot -o outfile.png

pydot Link to heading
beside the dot language and command line, there is python library to generate Graphs and dump png directly.
pip install pydot
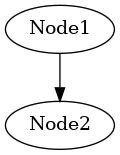
small example to show arrow between tow states.
import pydot


g = pydot.Dot()

node1 = pydot.Node("Node1")
node2 = pydot.Node("Node2")

g.add_node(node1)
g.add_node(node2)

g.add_edge(pydot.Edge(node1,node2))

g.write_png("example.png")
and output png is

pydot can load and write dot files but that for later post.